Note
Access to this page requires authorization. You can try signing in or changing directories.
Access to this page requires authorization. You can try changing directories.
As your organization scales from isolated copilots to autonomous multi-agent fleets, maintaining visibility and control becomes critical. The Foundry Control Plane provides a unified command center where you can monitor all agents, models, and tools across your enterprise from build to production.
This article shows you how to use the Foundry Control Plane's capabilities to track agent health, performance, compliance, and cost efficiency at scale. With centralized monitoring, you can identify issues early, optimize resource consumption, and ensure your AI systems operate safely and reliably.
Important
Items marked (preview) in this article are currently in public preview. This preview is provided without a service-level agreement, and we don't recommend it for production workloads. Certain features might not be supported or might have constrained capabilities. For more information, see Supplemental Terms of Use for Microsoft Azure Previews.
Prerequisites
- An Azure account with an active subscription. If you don't have one, create a free Azure account, which includes a free trial subscription.
- A Foundry project. If you don't have one, create a project.
- At least one agent deployed in your Foundry project and registered in Foundry Control Plane.
- Read access to the project and subscription you want to view data for.
Note
This capability is available only in the Foundry (new) portal. Look for  in the portal banner to confirm you're using Foundry (new).
What is fleet monitoring in the Foundry Control Plane?
The Foundry Control Plane gives you real-time visibility into your entire AI estate. Instead of monitoring agents individually, you get a unified view across all agents in your projects, whether they're Foundry-native, Microsoft services, or third-party integrations.
Key monitoring capabilities include:
- Fleet health metrics: Track active agents, run completion rates, and error trends across your entire fleet
- Compliance monitoring: View compliance posture, policy adherence, and prevented behaviors in real time
- Cost and performance tracking: Monitor token usage, budget consumption, and resource efficiency across all agents
- Anomaly detection: Identify cost spikes, performance degradation, and emerging issues through trend analysis
- Drill-down analysis: Navigate from fleet-level metrics to individual agent traces and logs for detailed investigation
Fleet monitoring serves multiple roles:
- Team managers gain oversight of agent operations and team productivity
- Administrators enforce governance policies and track compliance posture
- Cost managers optimize spending and identify resource inefficiencies
- Security teams monitor for prohibited behaviors and policy violations
View metrics
You can view aggregated metrics for all agents within a selected project by using Foundry. The Overview pane provides insights into fleet health, compliance, and performance trends.
-
Sign in to Microsoft Foundry. Make sure the New Foundry toggle is on. These steps refer to Foundry (new).

Select Operate from the upper-right navigation.
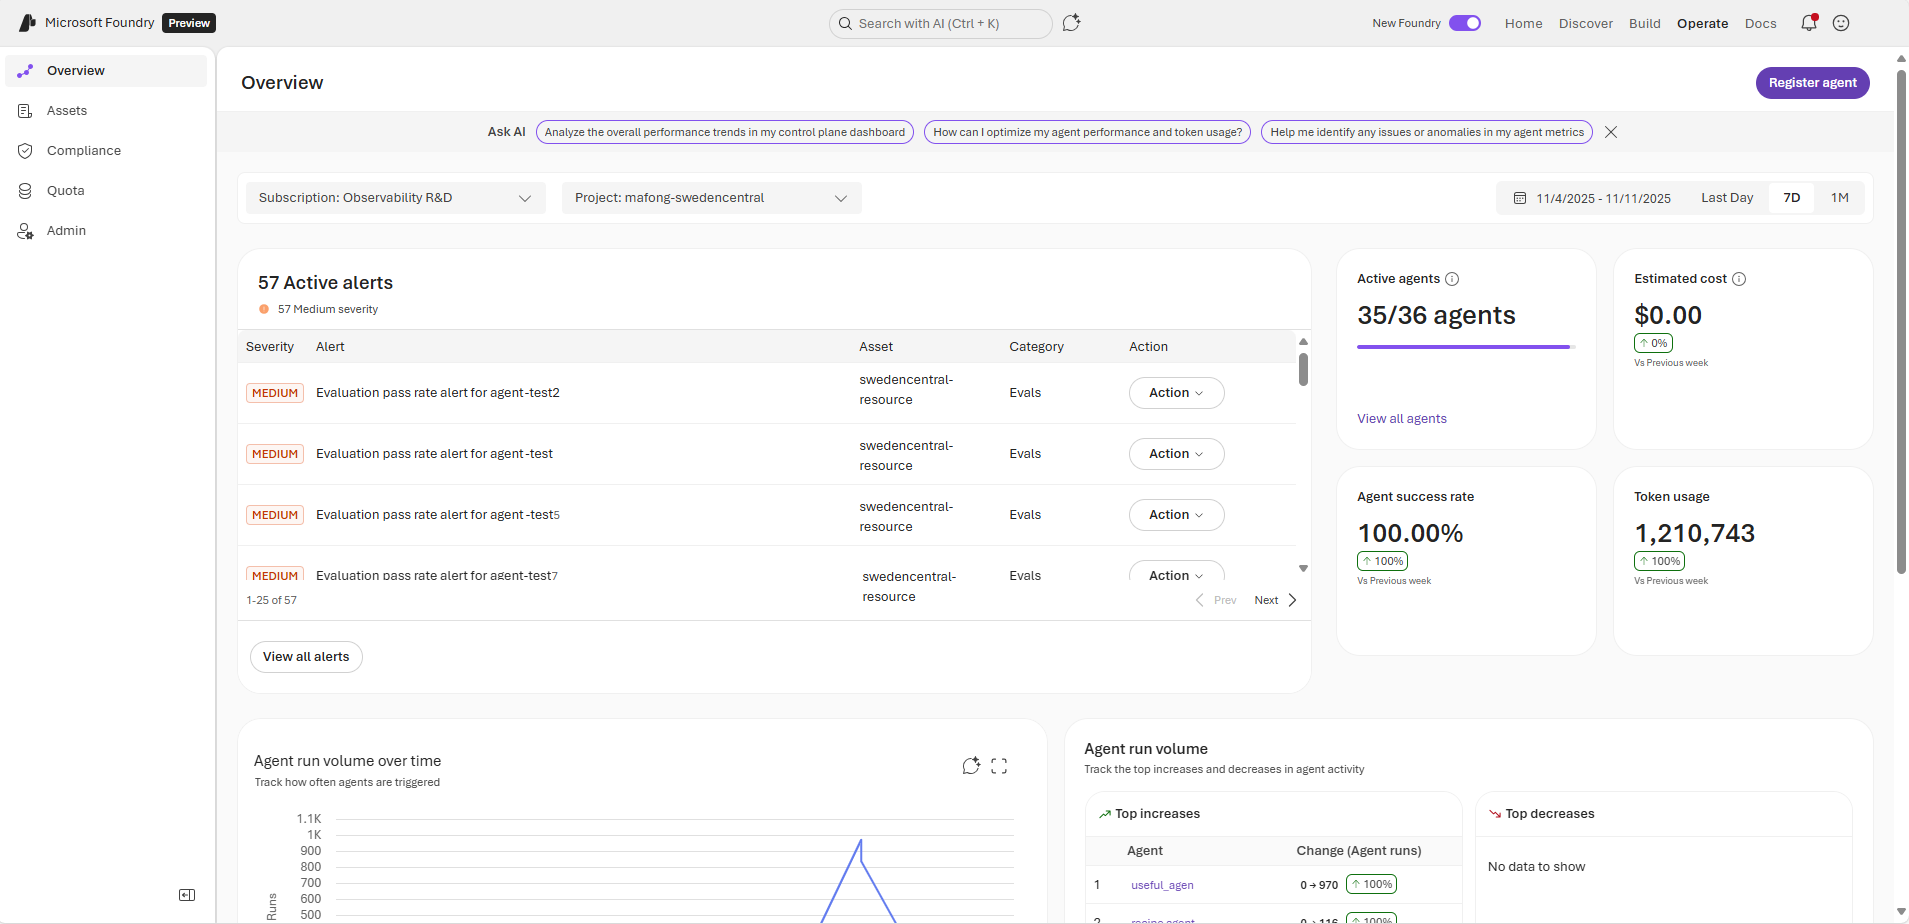
The Overview pane displays common metrics and insights for all registered agents in your selected project:
Monitor alerts: View issues grouped by severity and category, such as alerts for evaluation scores and policy and security violations.
Track fleet health: See metrics to help you assess the performance of agents in the selected projects, including total number of running agents and overall agent run success rates.
Analyze resource usage: Review total cost and token usage while monitoring changes in these metrics over time.
Visualize performance trends: Explore charts for agent run volume and top increases or decreases in activity.
View all assets
You can view all your assets under a specific project along with top-level metrics from Foundry.
-
Sign in to Microsoft Foundry. Make sure the New Foundry toggle is on. These steps refer to Foundry (new).

Select Operate from the upper-right navigation.
Select Assets in the left pane.
Select the Agents tab.
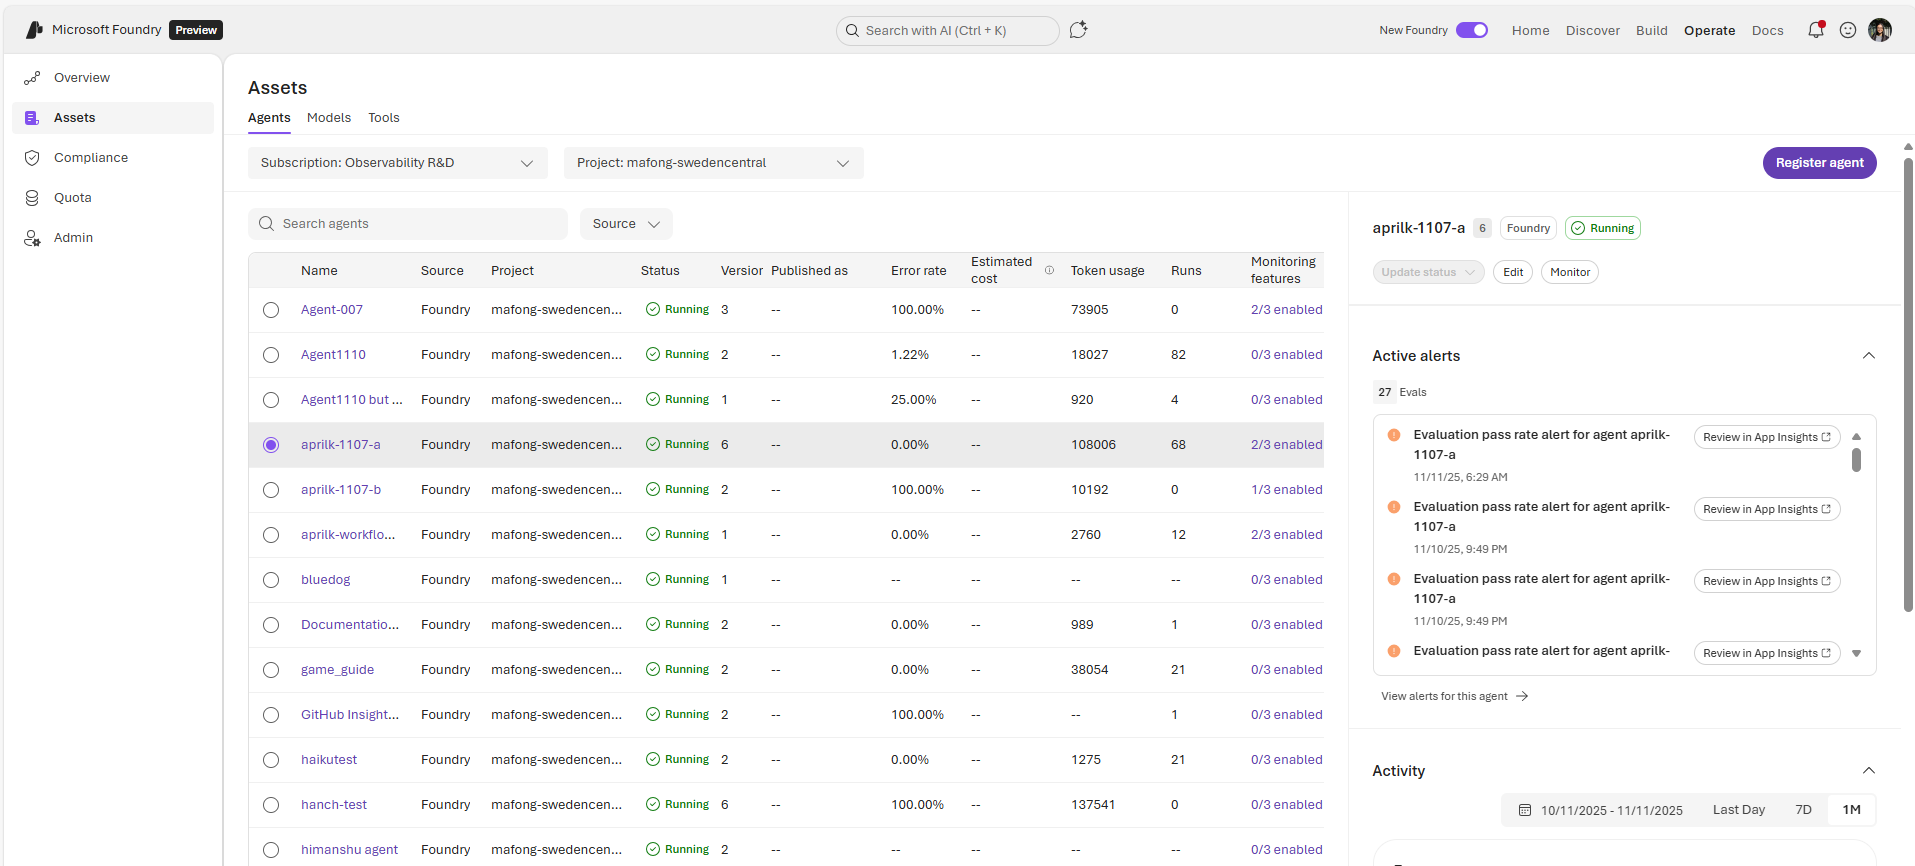
Review the overview of common metrics.
To view more granular information on the performance of an individual agent, the side panel provides quick insights into the selected agent's health and recent activity. You can use it to identify issues and take corrective actions.
In this section, you see:
Active alerts: View policy, security, and evaluation alerts grouped by severity and take action.
Activity: See key metrics such as error rate over time, total run information, and information on token usage.


